AWS publishes a CloudFormation template called Distributed Load Testing on AWS. Deploy it, point it at an endpoint, and it runs thousands of simulated users from containers across as many regions as you like. This is what it deploys, what it can and cannot test, what a run costs, and the things it finds in a platform that a functional test never will.
Most teams we work with have never load tested properly. Not because they do not care, but because generating load has historically meant owning machines that sit idle 99% of the month, and the tooling that avoids that is usually priced per virtual user.
The AWS solution removes both problems. It is an open source CloudFormation stack, it runs test containers on Fargate so you pay only while a test is running, and everything stays inside your own AWS account. Everything starts from the solution page in the AWS documentation, where the deploy options hand you to AWS Launch Wizard, and the first thing it asks for is a deployment pattern.
We deploy it for clients often enough that it is worth writing down how it works, how to install it without painting yourself into a corner, and where it stops being the right tool.
What the template deploys
One stack, a console, and containers that appear when you press start
Launching the stack gives you a small application, not just a script runner:
- A web console for defining and running tests, with a Cognito user pool in front of it.
- An API Gateway and Lambda backend that keeps test definitions and results in DynamoDB and S3.
- A Step Functions state machine that launches, monitors and cancels the test containers.
- ECS tasks on AWS Fargate doing the actual work, in whichever regions you deploy regional stacks to.
- A CloudWatch dashboard per test, plus an option to stream live results while a test runs.
The container image is Amazon Linux 2023 with Taurus installed. Taurus drives other load testing tools, which is how the solution supports several frameworks from one image.
How that console is served is a deployment-time decision that cannot be changed afterwards, which is why it gets a section of its own below.
What you can test with it
Anything that speaks HTTP, defined four different ways
The choice of framework happens when you create a scenario, covered in detail further down. The short version for deciding before you start:
| Test type | Use it when |
|---|
| Single HTTP endpoint | You want a number quickly and have no script. Set a URL, method, headers, body. |
| JMeter | You have existing .jmx scripts, or need a multi-step scenario with plugins and input files. |
| k6 | You would rather write scenarios in JavaScript and keep them in the repo with the code. |
| Locust | You want scenarios in Python. |
What sits on the other end can be almost anything with an endpoint: an API Gateway API, an ALB, EC2 instances, ECS or EKS services, Lambda, a CloudFront distribution, or an application whose real bottleneck turns out to be the RDS instance behind it.
Two capabilities are the actual reason to pick this over running a load tool on one machine.
Multi-region generation. Deploy regional stacks and one test can generate from several regions at once. That is the only honest way to see how your CDN, DNS routing and regional failover behave. Testing from one place tells you about one network path.
Scheduling. Tests run immediately, at a set time, or on a recurring cron expression in your own timezone. Combined with saved baselines, that turns load testing from a one-off panic before a launch into a regression check that runs every week.
What it does not do
It generates load. It does not tell you why the platform slowed down. You still need CloudWatch, Container Insights, X-Ray and your database's own tooling on the target side. And if a scenario needs genuinely complex logic, or results have to land in an observability stack you already run, driving k6 yourself on an ECS cluster gives you more control for not much more effort.
Installing it, step by step
One choice you cannot undo, then a wizard that walks you through the rest
From the solution page, the deploy options hand you to AWS Launch Wizard with the Distributed Load Testing workload selected.
Before going further, two things to set expectations. The screenshots below are version 4.2.2 deploying the CloudFront pattern, which is the default. Field labels and step counts move between releases, and some fields only appear depending on the pattern and the choices you make, so treat this as the shape of the process rather than a pixel-for-pixel map. The implementation guide always describes the current version.
The solution ID stamped on every resource it creates is SO0062, which matters later for cost tracking.
The first question the wizard asks is the only one the console tells you is irreversible, so it gets its own section.
Choosing a deployment pattern
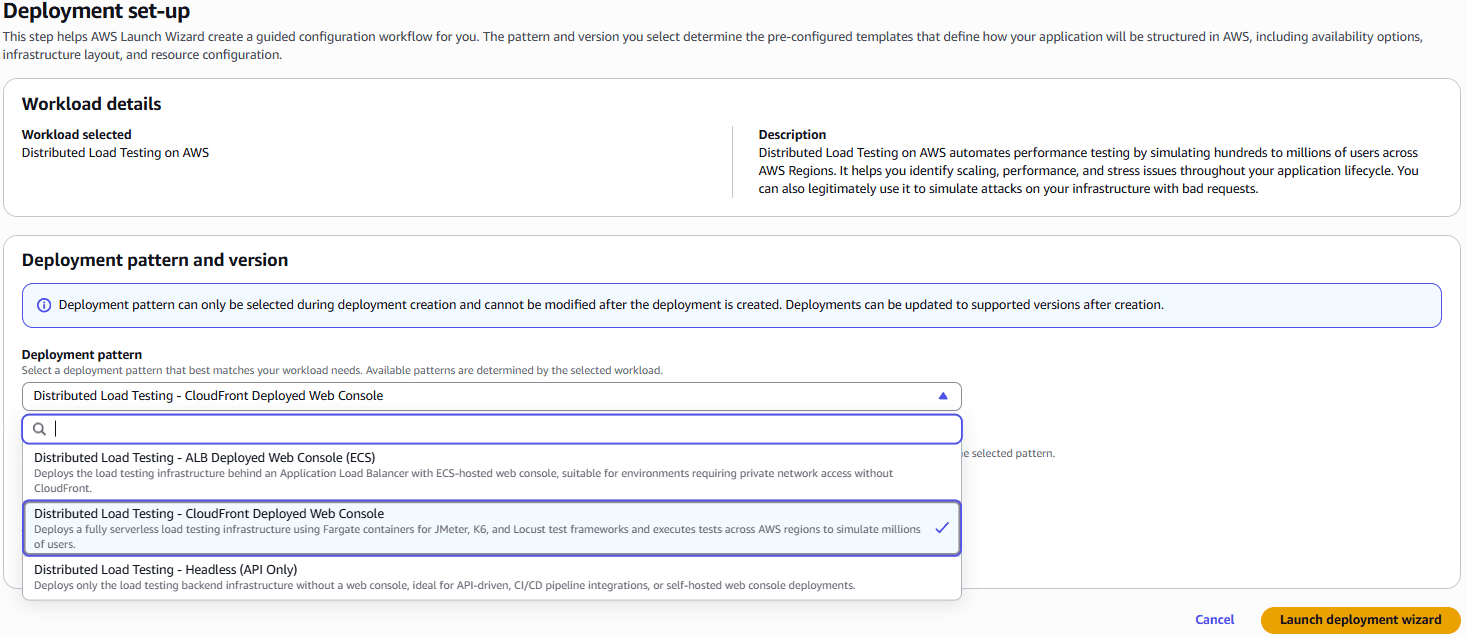
The pattern dropdown. This choice is locked once the deployment exists.
Three patterns, and the console banner is blunt about it: the pattern can only be selected during deployment creation and cannot be modified afterwards. Deployments can be upgraded to newer versions, but they cannot be switched from one pattern to another. Getting this wrong means tearing down and redeploying.
| Pattern | What it gives you | Pick it when |
|---|
| CloudFront deployed web console | The fully serverless option. Fargate containers running JMeter, k6 and Locust, with the console served through CloudFront. | Default choice. You want the console reachable from anywhere and have no restriction on public CloudFront distributions. |
| ALB deployed web console (ECS) | The same backend, with the console hosted on ECS behind an Application Load Balancer instead. | Your account blocks public CloudFront distributions, or policy requires the console to be reachable only over private network access. |
| Headless (API only) | Backend infrastructure with no web console at all. | You are driving tests from a CI/CD pipeline or your own tooling through the API, or you intend to host the console yourself. |
Two things worth thinking about for longer than the dropdown suggests.
If you are in a regulated environment, the ALB and headless patterns are frequently what makes the solution usable at all. Plenty of security policies simply forbid a public CloudFront distribution in a workload account, and that rules out the default before you start.
If you plan to run load tests from a pipeline rather than by hand, headless is not a downgrade. The console is convenient for exploring, but scheduled regression tests want to be triggered by the same thing that triggers your deployments. You can always add a self-hosted console later.
Step 1: general configuration
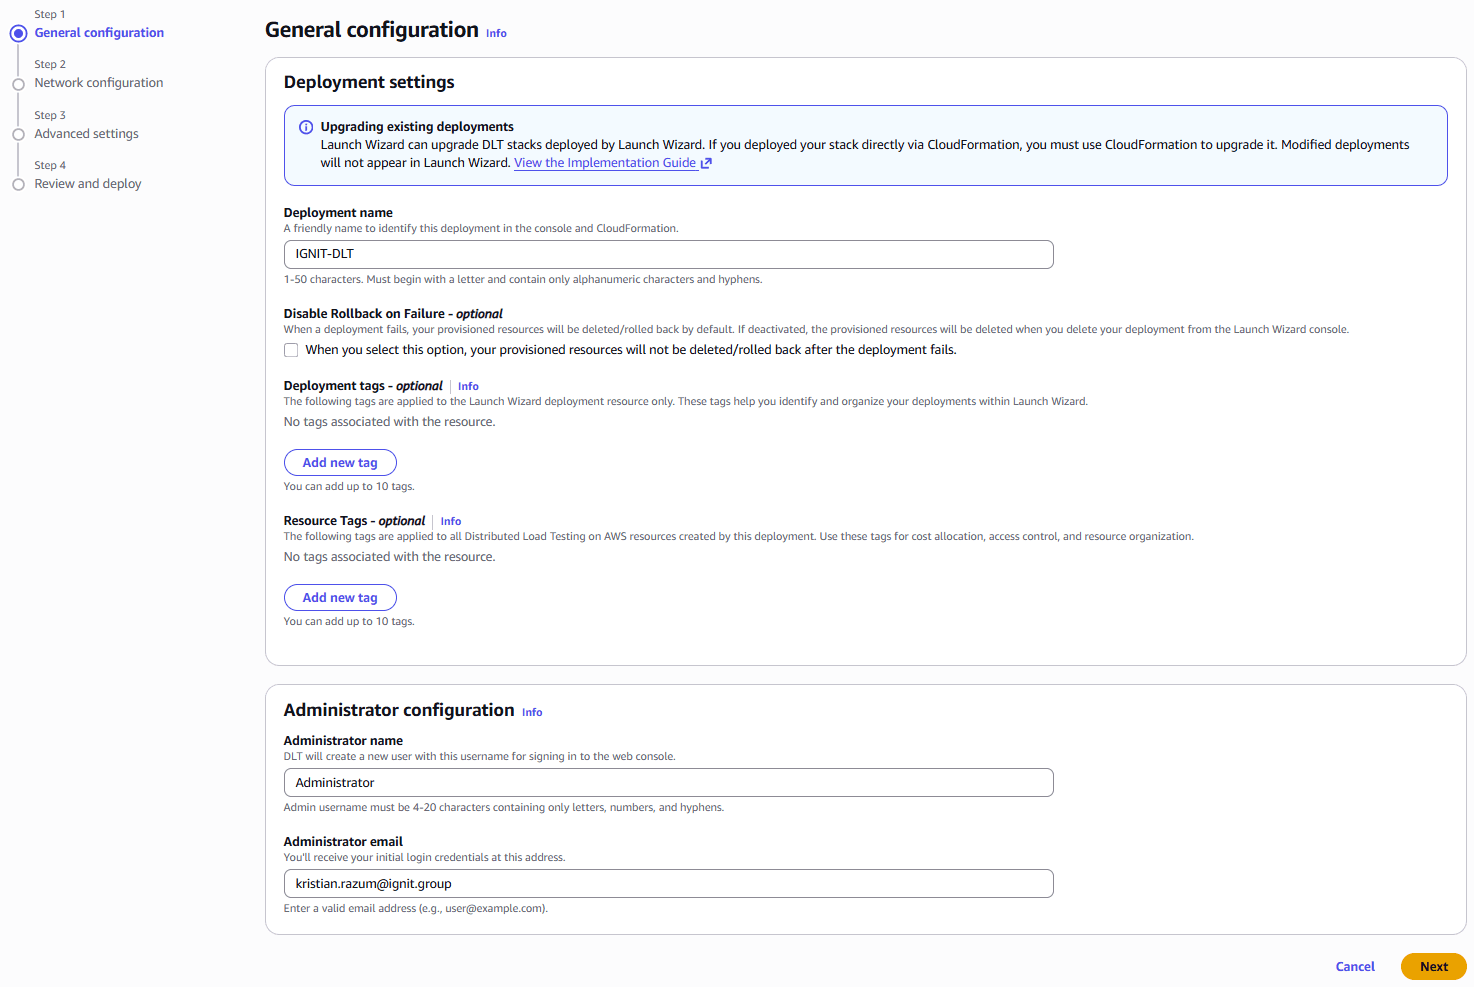
Deployment name, rollback behaviour, two kinds of tags, and the admin who gets the first login.
Read the blue callout at the top before anything else, because it describes a one-way door. Launch Wizard can upgrade DLT stacks that Launch Wizard deployed. If you deploy the stack directly from CloudFormation, you have to upgrade it through CloudFormation, and modified deployments stop appearing in Launch Wizard at all. Pick one route and stay on it. We use the wizard for the first deployment and leave the stack alone afterwards, precisely so upgrades stay simple.
The fields:
- Deployment name. One to fifty characters, has to start with a letter, letters, numbers and hyphens only. This is how you will find it in both the Launch Wizard console and CloudFormation, so include the environment:
dlt-perf-staging beats dlt-test-2.
- Disable rollback on failure. Off by default, which means a failed deployment cleans up after itself. Tick it only when a deployment has already failed once and you need to inspect what got created before it broke. With it ticked, the resources survive the failure and stay on your bill until you delete the deployment from the Launch Wizard console.
- Deployment tags. Up to ten, and they apply only to the Launch Wizard deployment resource. Useful for organising the wizard console, not much else.
- Resource tags. Up to ten, applied to every DLT resource the deployment creates. These are the ones that matter. This is where you add your cost allocation and ownership tags, and it is far easier than retrofitting tags across a stack later.
- Administrator name and email. Four to twenty characters for the name. The email address receives the initial console credentials, so use one someone actually reads. A shared team alias is better than an individual, because the person who deploys is rarely the only person who needs to run a test.
The solution also tags everything it creates with SolutionId: SO0062 on its own, which is what makes the cost tracking in the next section possible.
Step 2: network configuration
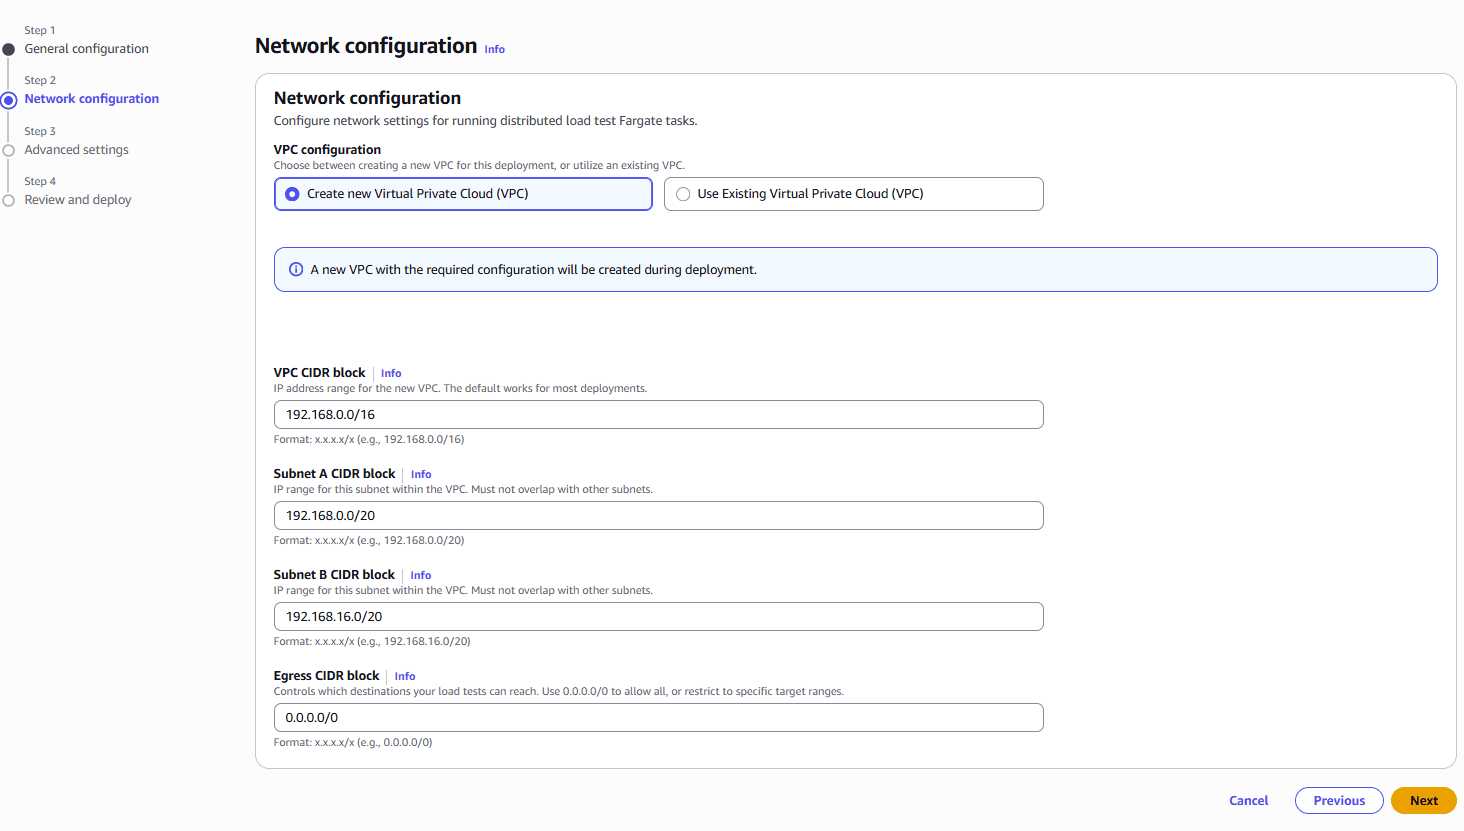
Where the Fargate tasks will run, and how far they are allowed to reach.
This screen configures the network the test tasks run in, and the defaults are sensible for almost everyone.
Create a new VPC or use an existing one. Take the new VPC unless you have a specific reason not to. Load generators do not need to sit next to anything, and a dedicated VPC keeps the test traffic out of your application's flow logs and route tables. Use an existing VPC when the target is internal and only reachable from inside your network, which is the main legitimate case.
The CIDR blocks. Defaults are a 192.168.0.0/16 VPC with two /20 subnets across two availability zones. That gives roughly four thousand addresses per subnet, which is plenty. Change these only if the ranges collide with something you peer with, and if you are using an existing VPC, remember that every Fargate task consumes an IP address. A few hundred tasks in a small subnet will exhaust it, and the error you get looks nothing like the cause.
Egress CIDR block. This is the field to think about. It controls which destinations the load tests are allowed to reach, and it defaults to 0.0.0.0/0, meaning anywhere on the internet. That is convenient and it is also a load generator with unrestricted outbound access sitting in your account.
If your targets are known, restrict it. Narrowing egress to the ranges you actually intend to test turns "someone pointed the harness at the wrong hostname" from an incident into a failed connection. That mistake is easier to make than it sounds when a test definition is copied between environments.
Step 3: advanced settings
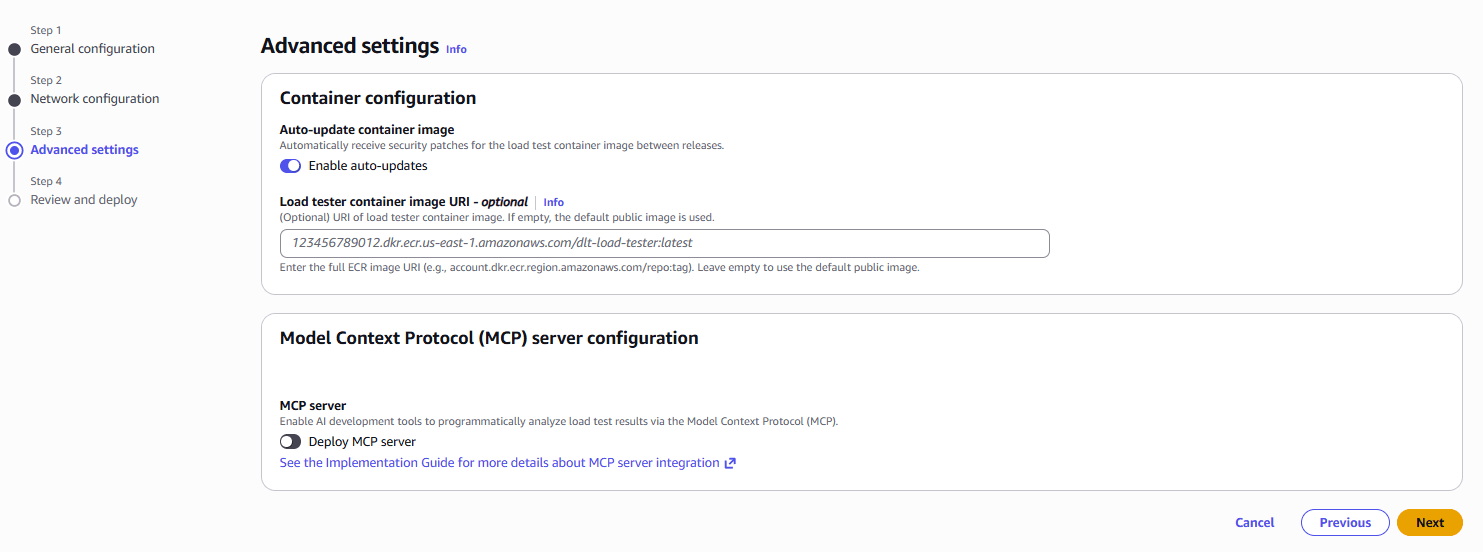
Container image handling, and the optional MCP server.
Three optional settings, all safe to leave alone on a first deployment.
Auto-update container image. Off by default. Turned on, the load test container picks up security patches between solution releases. We turn this on for long-lived deployments, because a test runner that goes months without patching is a container image nobody is watching. The argument against is reproducibility: if you are comparing a run against a baseline from six months ago, a changed image is one more variable. If that matters to you, leave it off and update deliberately.
Load tester container image URI. Empty means the default public image, which is what most people want. Supply an ECR URI here when you need something the stock image does not have, such as an extra JMeter plugin or a Python dependency for a Locust scenario. Build from the public image, push to your own ECR repository, and put the full URI in this field.
MCP server. Off by default. Enabling it deploys an MCP server so AI development tools can query your load test results programmatically, through the Model Context Protocol, with access gated by the same Cognito authentication as the console. If your team already works with AI tooling connected to your systems, this turns "read the results dashboard" into "ask what regressed since the last baseline." If not, leave it off. It is one more component to secure and upgrade for no benefit.
Step 4: review and deploy
The last screen is a summary. Check two things before you commit: the deployment pattern, because that is the choice you cannot take back, and the administrator email, because that is where the only set of credentials is going.
Then it deploys. How long depends on the pattern and the region, so watch the deployment status in Launch Wizard rather than a stopwatch. The credentials email is the signal that it has finished.
Your credentials arrive by email
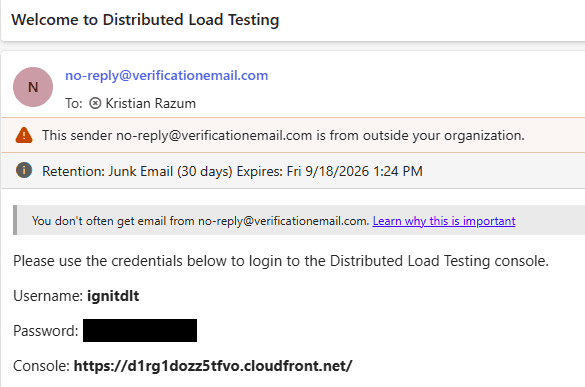
The welcome email. Note which folder it landed in.
When the stack finishes, the administrator address gets a message titled "Welcome to Distributed Load Testing" containing a username, a temporary password and the console URL.
Check your junk folder. The sender is no-reply@verificationemail.com, which is the default Cognito address, and plenty of corporate mail filters treat an unfamiliar external sender handing out credentials exactly the way you would hope they would. Ours went straight to junk. If Launch Wizard reports the deployment as complete and nothing has arrived, check junk before you go digging in CloudFormation.
Sign in with the temporary password and you are asked to set a real one immediately. From here everything happens in the DLT console rather than in Launch Wizard.
One habit worth adopting: add the console URL to your password manager along with the credentials as soon as you are in. The URL is a CloudFront domain with no memorable name in it, and it is easy to lose.
If you would rather skip the wizard
CloudFormation directly is still supported and is the right call if you keep infrastructure in code. Take the current template URL from the solution page rather than pinning an old one:
aws cloudformation create-stack \
  --region eu-central-1 \
  --stack-name dlt-primary \
  --template-url https://solutions-reference.s3.amazonaws.com/distributed-load-testing-on-aws/latest/distributed-load-testing-on-aws.template \
  --parameters \
      ParameterKey=AdminName,ParameterValue=perf \
      ParameterKey=AdminEmail,ParameterValue=perf@example.com \
  --capabilities CAPABILITY_IAM CAPABILITY_NAMED_IAM
Just remember the trade-off from step 1. Deploy this way and Launch Wizard will not manage it, so every future upgrade is yours to run through CloudFormation.
The console on first login
What the dashboard tells you, and how to add regions
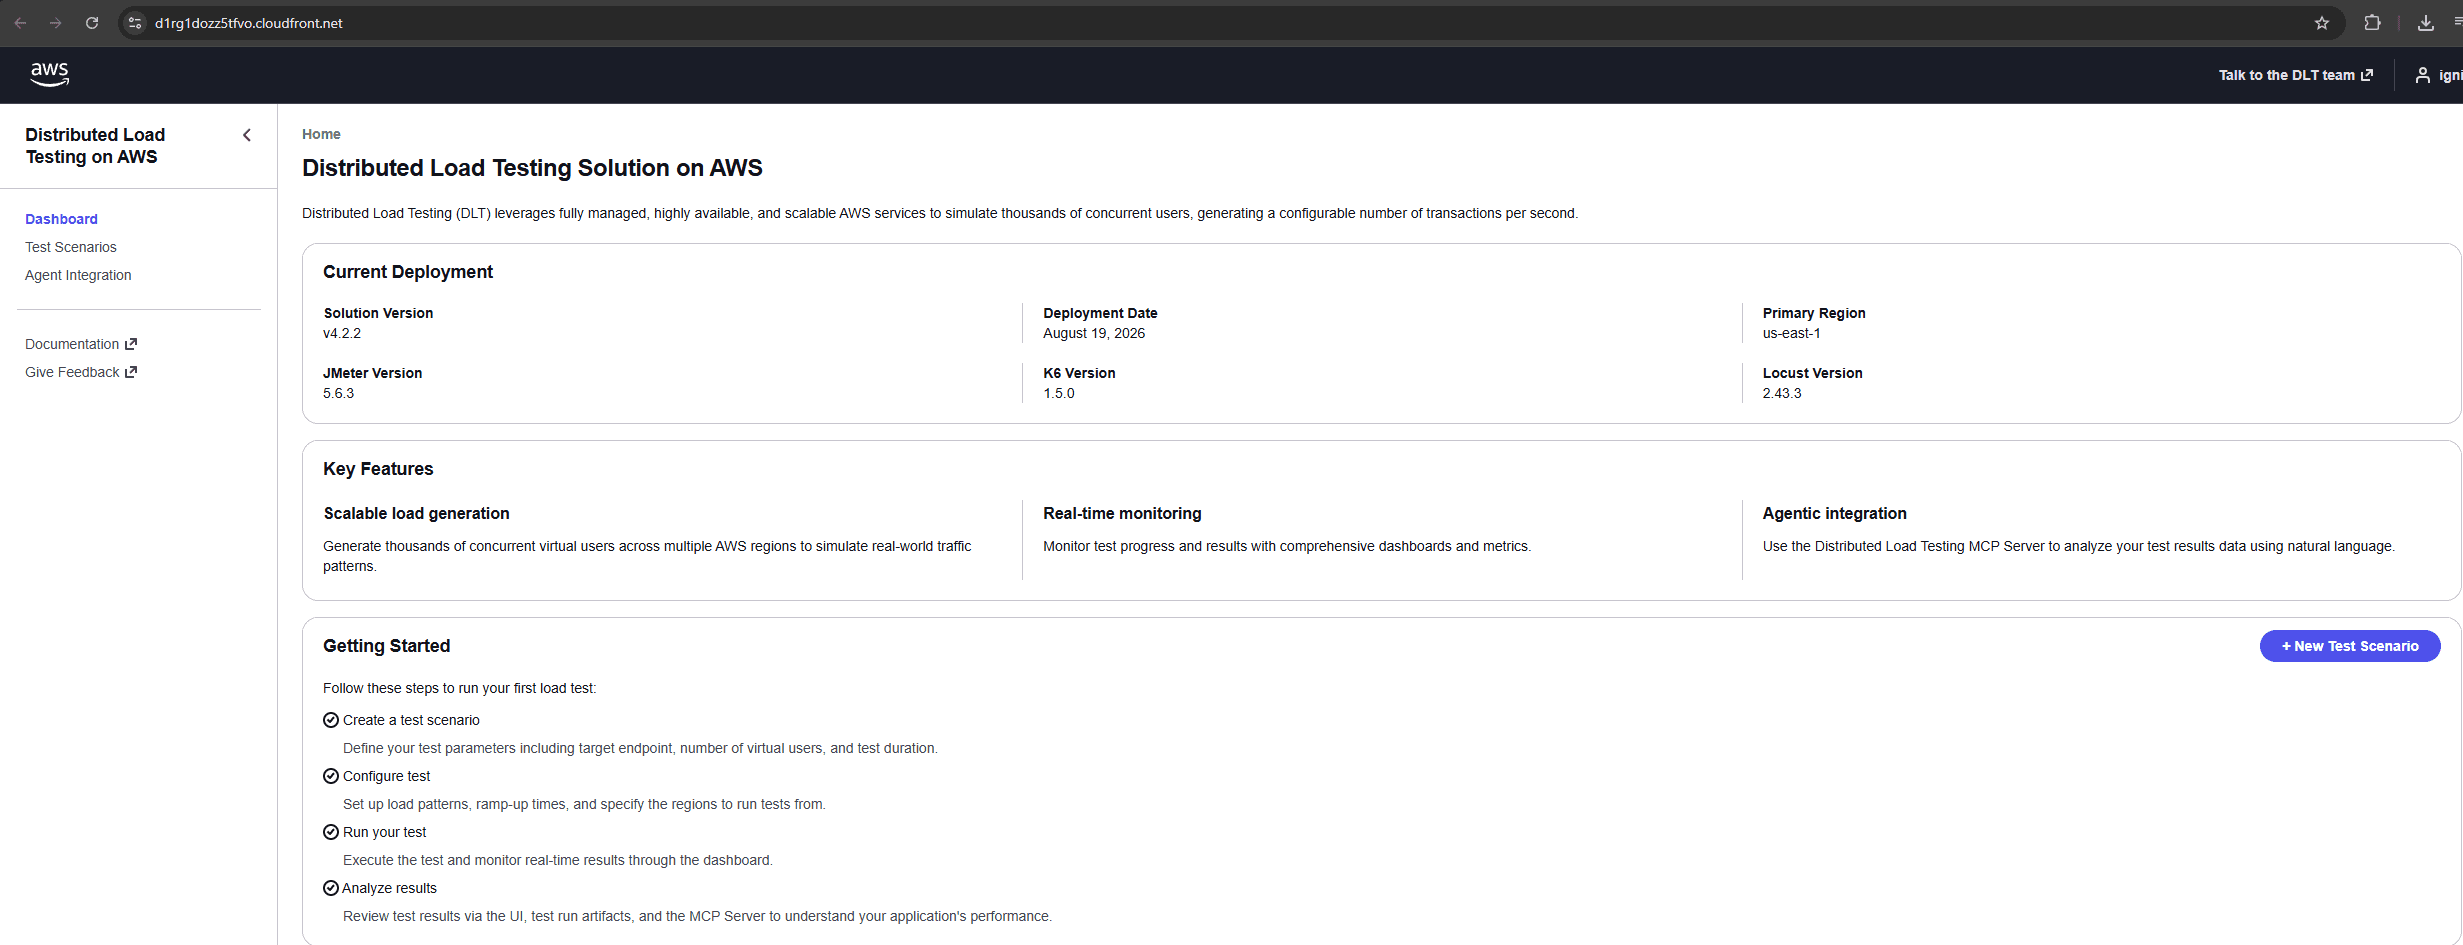
The dashboard. Bundled framework versions, deployment status and the regional stack tooling all live here.
The landing page is more useful than a welcome screen usually is. Three panels are worth reading before you do anything.
Current deployment gives you the solution version, deployment date and primary region, plus the exact versions of the three bundled frameworks. Ours reports v4.2.2 running JMeter 5.6.3, k6 1.5.0 and Locust 2.43.3. Write those down. When a scenario behaves oddly, the framework version is the first thing you will want, and it is the thing you will otherwise go hunting for.
Multi-region deployments lists your hub and its spokes with a compatibility column. The hub is the deployment you just made. Spokes are the regional stacks you add. That compatibility check is the guardrail mentioned earlier: a spoke on a different version than the hub shows as incompatible and its region will not run.
Deploy regional stack is how you add those spokes, and there is one step in it people miss. The button opens the CloudFormation console with the regional template preloaded, and you have to switch the region in the AWS navigation bar before you create the stack. Miss that and you get a second stack in the region you are already in, which does nothing useful and costs you the time to find it. There are also buttons to download the template or copy its S3 URL, which is what you want if regional stacks are going into your own infrastructure pipeline.
The left navigation is short: dashboard, test scenarios, and agent integration for the MCP server if you enabled it during install.
Configuring a test scenario
Every field on the form, and which ones actually change your results
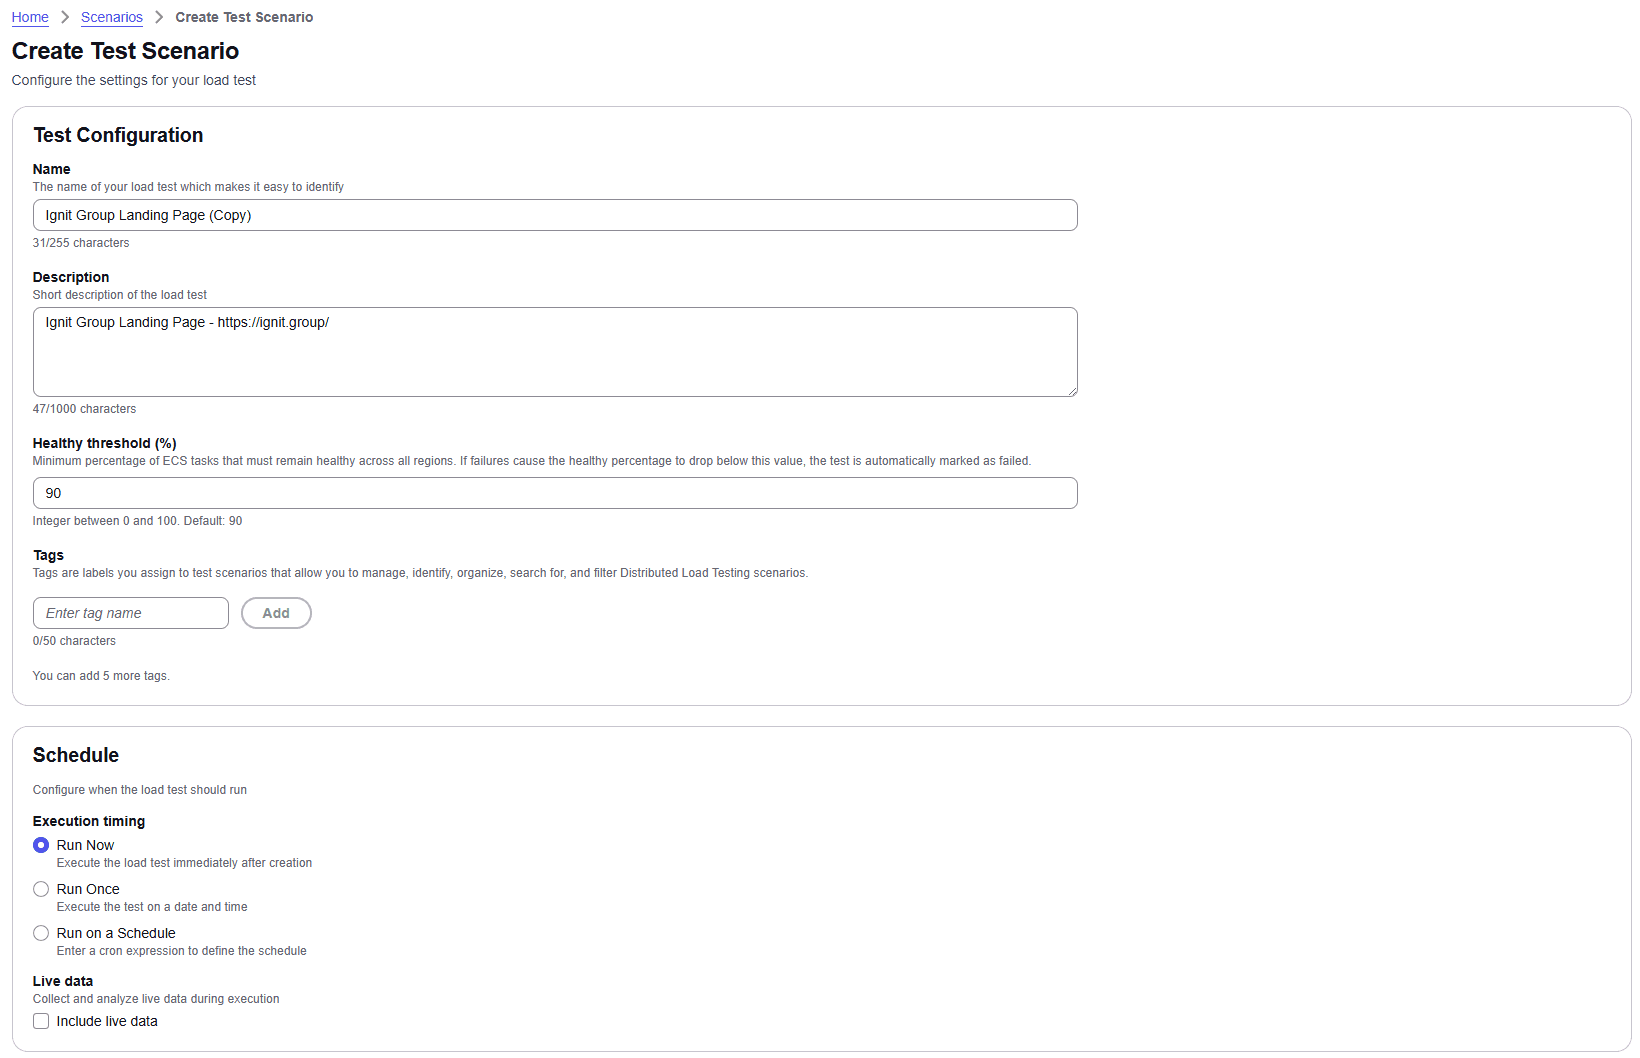
Name, description, healthy threshold, tags and scheduling.
New test scenario opens one long form. It is not complicated, but several fields quietly determine whether the results mean anything.
Test configuration
Name and description. Up to 255 and 1,000 characters. Worth more thought than it looks, because scenarios accumulate. Landing page tells you nothing in six months. Landing page, cached, 5k users, baseline tells you what it was for.
Healthy threshold. This one is genuinely important and easy to skim past. It is the minimum percentage of ECS tasks that must stay healthy across all regions, and if failures push you below it, the test is automatically marked failed. Default is 90.
Think about what that protects you from. If a third of your load generators die mid-run, the remaining traffic is not the test you designed, and without this threshold you would get a result that looks like a pass at a load you never actually generated. Leave it at 90 unless you have a reason. Lowering it to tolerate flaky tasks means accepting results from a test that partly did not happen.
Tags. Labels for organising and filtering scenarios. The console tells you how many you have left. Use them for environment and owner, and you will find things later.
Schedule
Three execution modes:
- Run now, which starts the test as soon as you create it.
- Run once, on a date and time you pick. Useful for booking a window agreed with the on-call rota.
- Run on a schedule, with a cron expression. This is the one that turns load testing from an event into a habit. A weekly run against a saved baseline catches regressions while they are still cheap.
Include live data is a checkbox, off by default. On, it streams metrics during execution so you can watch the test happen rather than wait for the summary. Leave it on while you are learning what your platform does, because seeing latency bend in real time tells you more than the same curve after the fact. Turn it off for long scheduled runs. It routes container logs through a Lambda function during the test, and on a large run that is CloudWatch ingestion you are paying for and probably not watching at 3am.
Test type
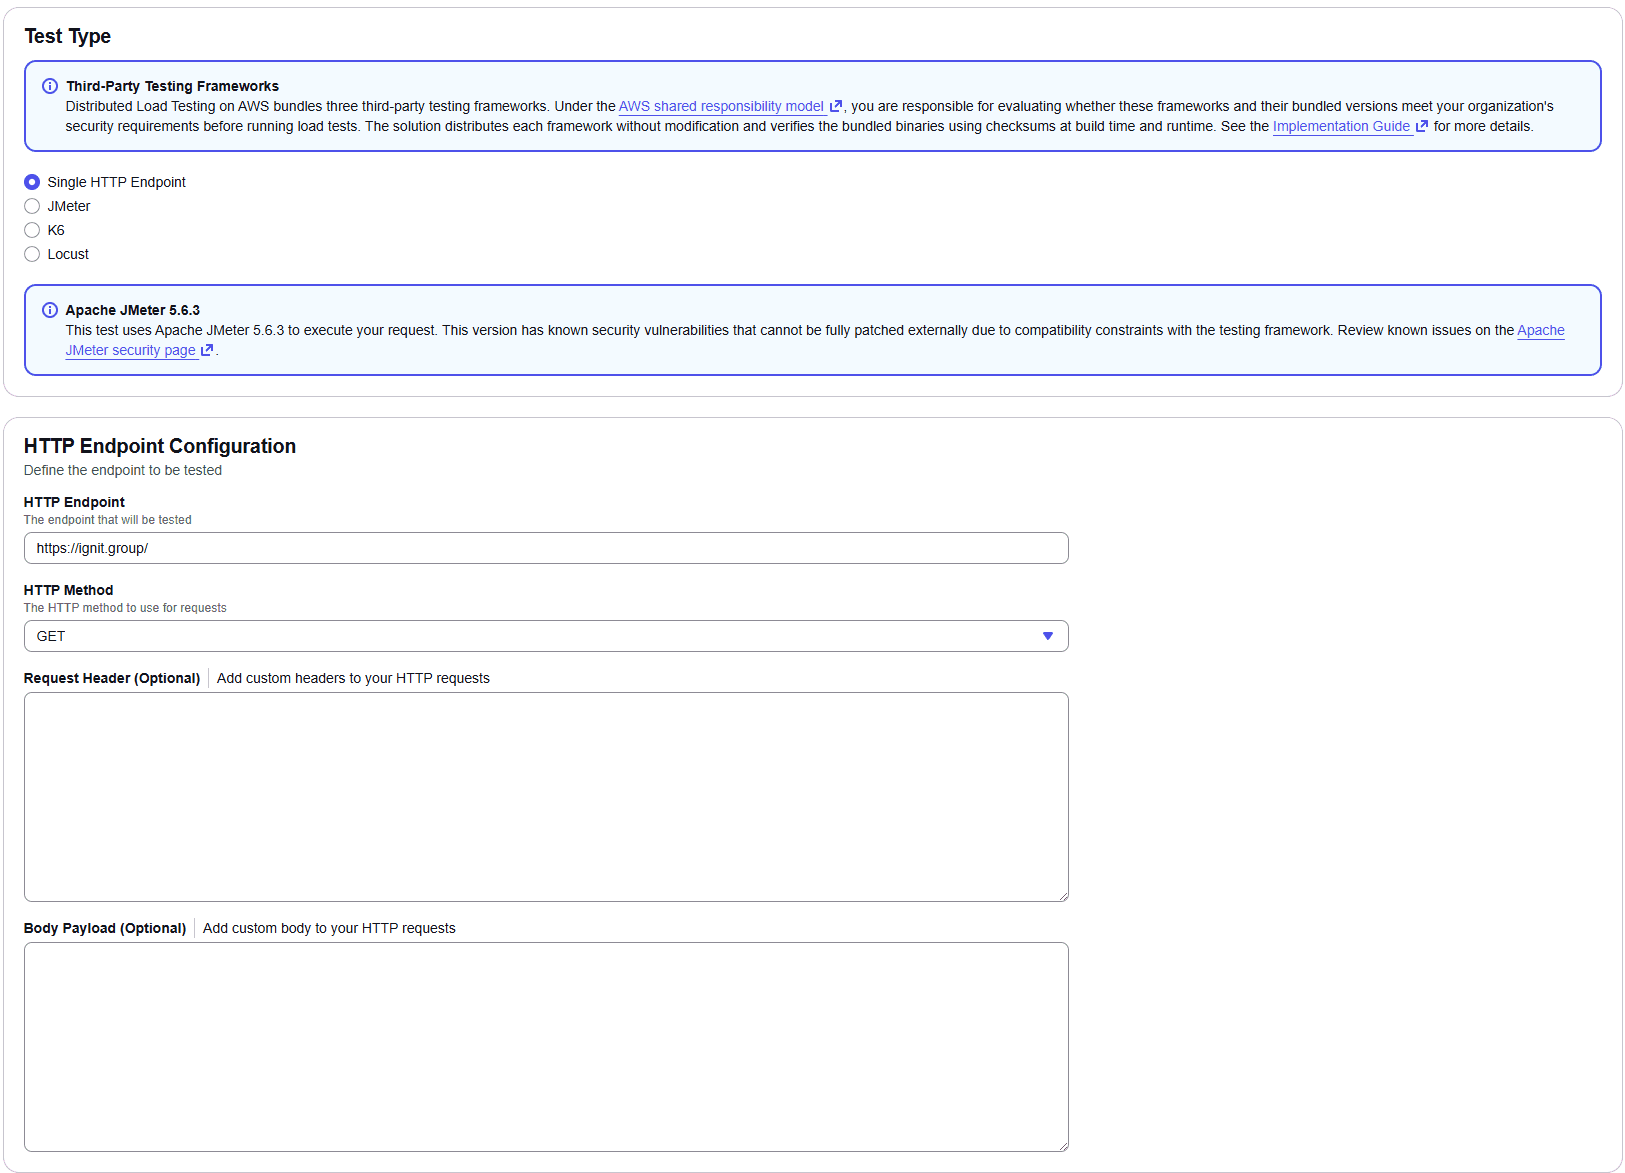
Four frameworks, two security notices worth reading, and the endpoint definition.
Four options: single HTTP endpoint, JMeter, k6 and Locust. Start with single HTTP endpoint. It needs no script, and for finding a first ceiling on one path it is entirely sufficient.
Two notices on this screen deserve to be read rather than dismissed.
The first is the shared responsibility notice. The solution bundles three third-party frameworks, distributes each without modification, and verifies the binaries by checksum at build time and at runtime. Evaluating whether those frameworks and their bundled versions meet your organisation's security requirements is your side of the line, not AWS's.
The second is specific and more pointed. Selecting a test that runs on Apache JMeter surfaces a notice that the bundled version has known security vulnerabilities which cannot be fully patched externally, because of compatibility constraints with the framework itself. That is not a reason to avoid the solution, and it is a reason to keep your load testing deployment in an account of its own rather than alongside production workloads. It is also an argument for k6 or Locust if your scenario does not specifically need JMeter.
HTTP endpoint configuration is the simple part: the endpoint URL, the HTTP method, and optional request headers and body payload. The headers field is where the WAF allowlist header from later in this post goes, and where authentication tokens go if you are testing behind a login.
Regional task availability and traffic
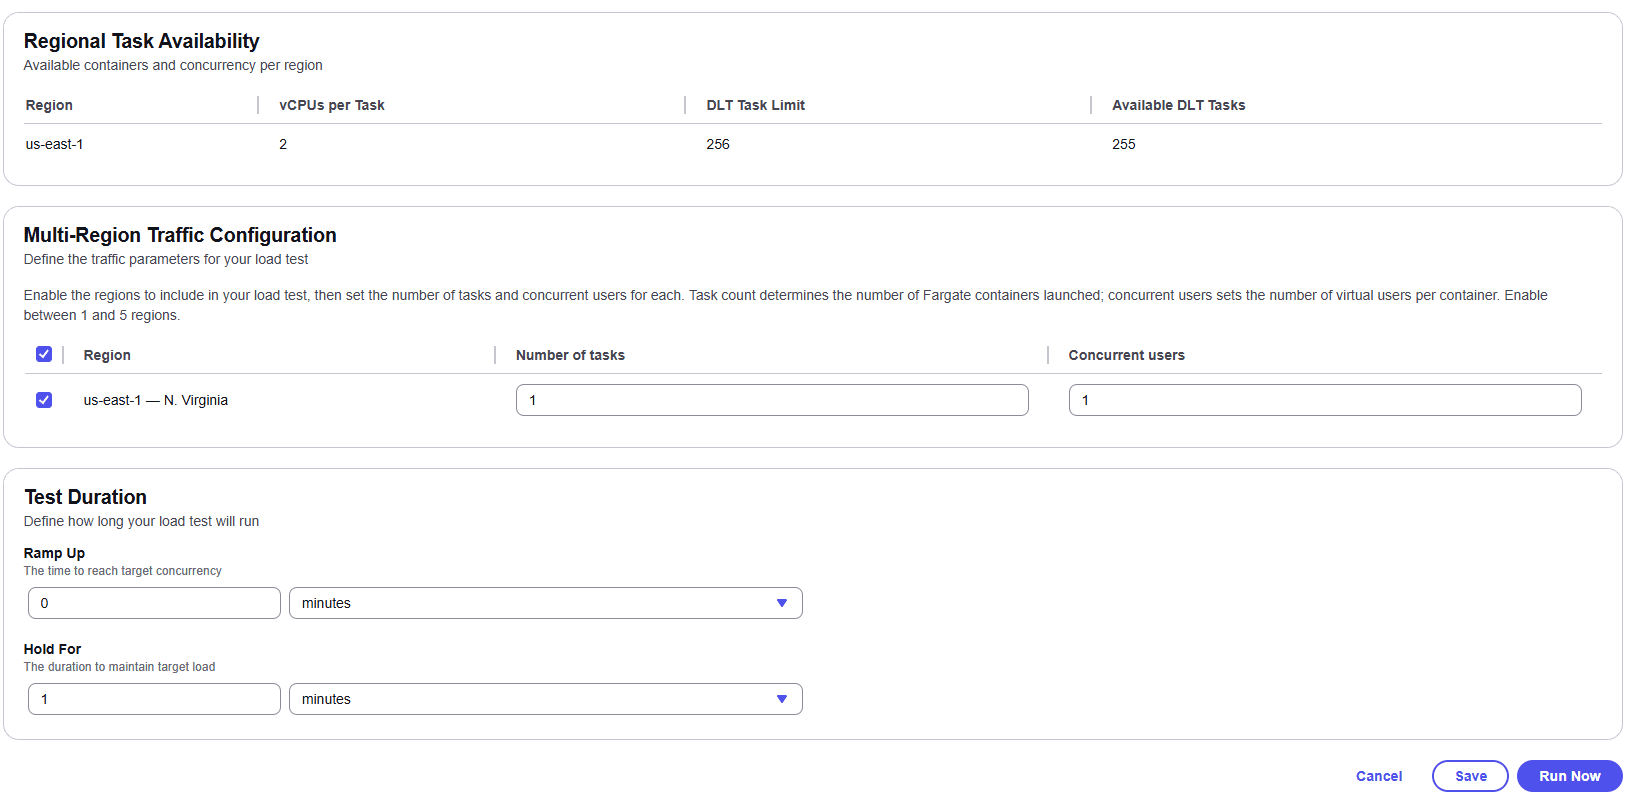
How much capacity you have, how to spend it, and how long to run.
The regional task availability panel is the one to look at before you type any numbers. It shows, per region, the vCPUs per task, your DLT task limit and how many tasks are currently available. Ours shows 2 vCPUs per task and a limit of 256 tasks in us-east-1.
That limit is your Fargate on-demand vCPU quota expressed in tasks, and having it on screen saves you doing the arithmetic. If the number is smaller than the test you have planned, that is your cue to request a quota increase, and to do it days ahead rather than the morning of the run.
Multi-region traffic configuration is where you enable regions and set two numbers for each: the number of tasks, which is how many Fargate containers launch, and concurrent users, which is how many virtual users run inside each container. You can enable between one and five regions, and each gets its own pair of numbers, so you can weight the test to match where your users actually are rather than splitting evenly.
Total virtual users for the run is the sum across regions of tasks times concurrent users. That multiplication is where most bad load tests are born, which is the subject of the next section.
Test duration
Two fields, each with a unit dropdown:
- Ramp up, the time taken to reach target concurrency.
- Hold for, how long to stay there once you arrive.
Ramp-up is not a formality. A short ramp is a spike test and a long one is a capacity test, and they answer different questions about your platform. If your target sits behind CloudFront, AWS asks for at least 30 minutes of ramp on large tests.
Hold-for needs to be long enough for the system to settle after scaling. If you hold for five minutes and your auto scaling takes four to react, you measured the transition rather than the steady state. Fifteen to thirty minutes is a reasonable default for anything you intend to draw conclusions from.
Then save, or run now. Save is the better habit. It gives you the scenario as a reusable object you can schedule, adjust and compare against later.
Running a test without fooling yourself
The step everyone skips, and the arithmetic that replaces guessing
The form accepts your numbers without complaint, which is the problem. The temptation is to push concurrent users high and task count low, because tasks cost money and virtual users do not.
That is the mistake worth avoiding. A saturated container reports its own queueing as your application's latency, and you walk away with a confident, precise, wrong number.
AWS puts the recommended concurrency at 200 virtual users per task on the default 2 vCPU and 4 GB task. JMeter in particular grows JVM memory as concurrency climbs. Treat 200 as a ceiling, not a target.
So before the real test, run one task and step the users up while watching two things: container CPU and memory in Container Insights, and the gap between the latency the test reports and the latency the target reports. On an ALB that second number is TargetResponseTime. While the two agree, the test is honest. When they diverge, you have found the container's limit rather than your platform's. Drop back a step and add tasks instead of users.
Twenty minutes of work, and it is the difference between a number you can plan capacity with and a number that is quietly about Fargate.
Sizing the test before you book a window
How many virtual users do you actually need? This is arithmetic, not guesswork. Concurrency is throughput multiplied by the time each user occupies the system, which is response time plus think time:
virtual users = target RPS x (response time + think time)
Say you need to prove 5,000 requests per second, responses average 200 ms, and a real user pauses about 3 seconds between actions. Each user occupies 3.2 seconds per request:
5,000 x 3.2 = 16,000 virtual users
16,000 / 200 per task = 80 tasks
80 tasks x 2 vCPU = 160 vCPU of Fargate quota
80 tasks x $0.099 = about $8 per hour of test
Now you know the quota to request and the budget to approve before anyone opens the console.
Two adjustments in practice. If calibration shows the container cannot hold 200 users for your particular scenario, lower the concurrency and add tasks to compensate. And if think time is zero, because you are testing a machine-to-machine API rather than a human-facing app, the same formula gives you far fewer users for the same throughput. That is why API tests need fewer tasks than people expect, and why copying a web test's task count onto an API test wastes money.
Reading the results
What the numbers mean, and which of them your sample size can support
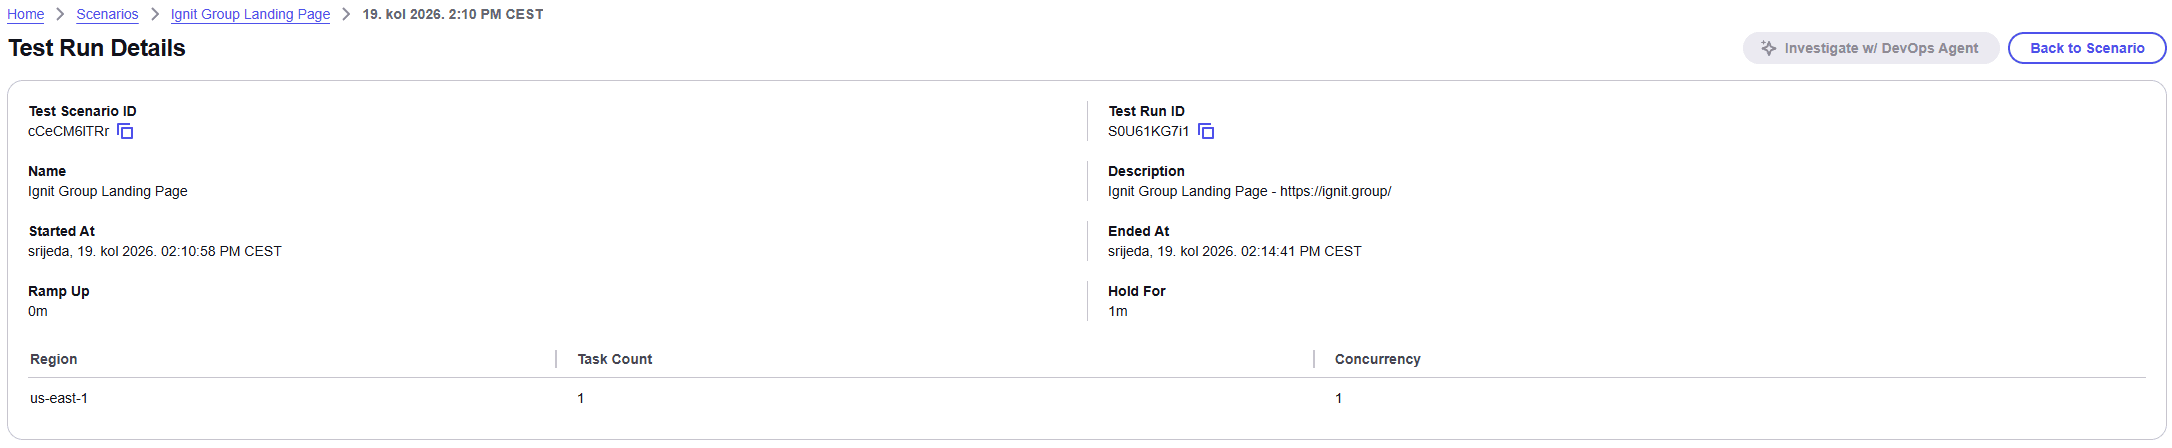
Test run details. Configuration at the top, summary table below.
Here is a real first run against our own landing page, and it is worth walking through because almost everything about it is typical of a first run.
One task, one concurrent user, no ramp, hold for one minute. That produced 66 requests at 1.1 requests per second, all successful.
That is a smoke test, not a load test, and it is exactly the right first run. It proves the harness works, the endpoint is reachable from the test region, credentials and headers are correct, and results come back. It tells you nothing whatsoever about capacity. Do this before every real test window. Finding out that your endpoint returns 403 to the test client is much cheaper at one user than at ten thousand.
One thing to notice immediately: the run started at 14:10:58 and ended at 14:14:41. Nearly four minutes of wall clock for one minute of load. The difference is Fargate task startup, test execution and results parsing. When you estimate cost, that overhead is on the bill, so a run that holds for ten minutes is not ten minutes of task time. On short tests the overhead can exceed the test.
Volume and performance metrics
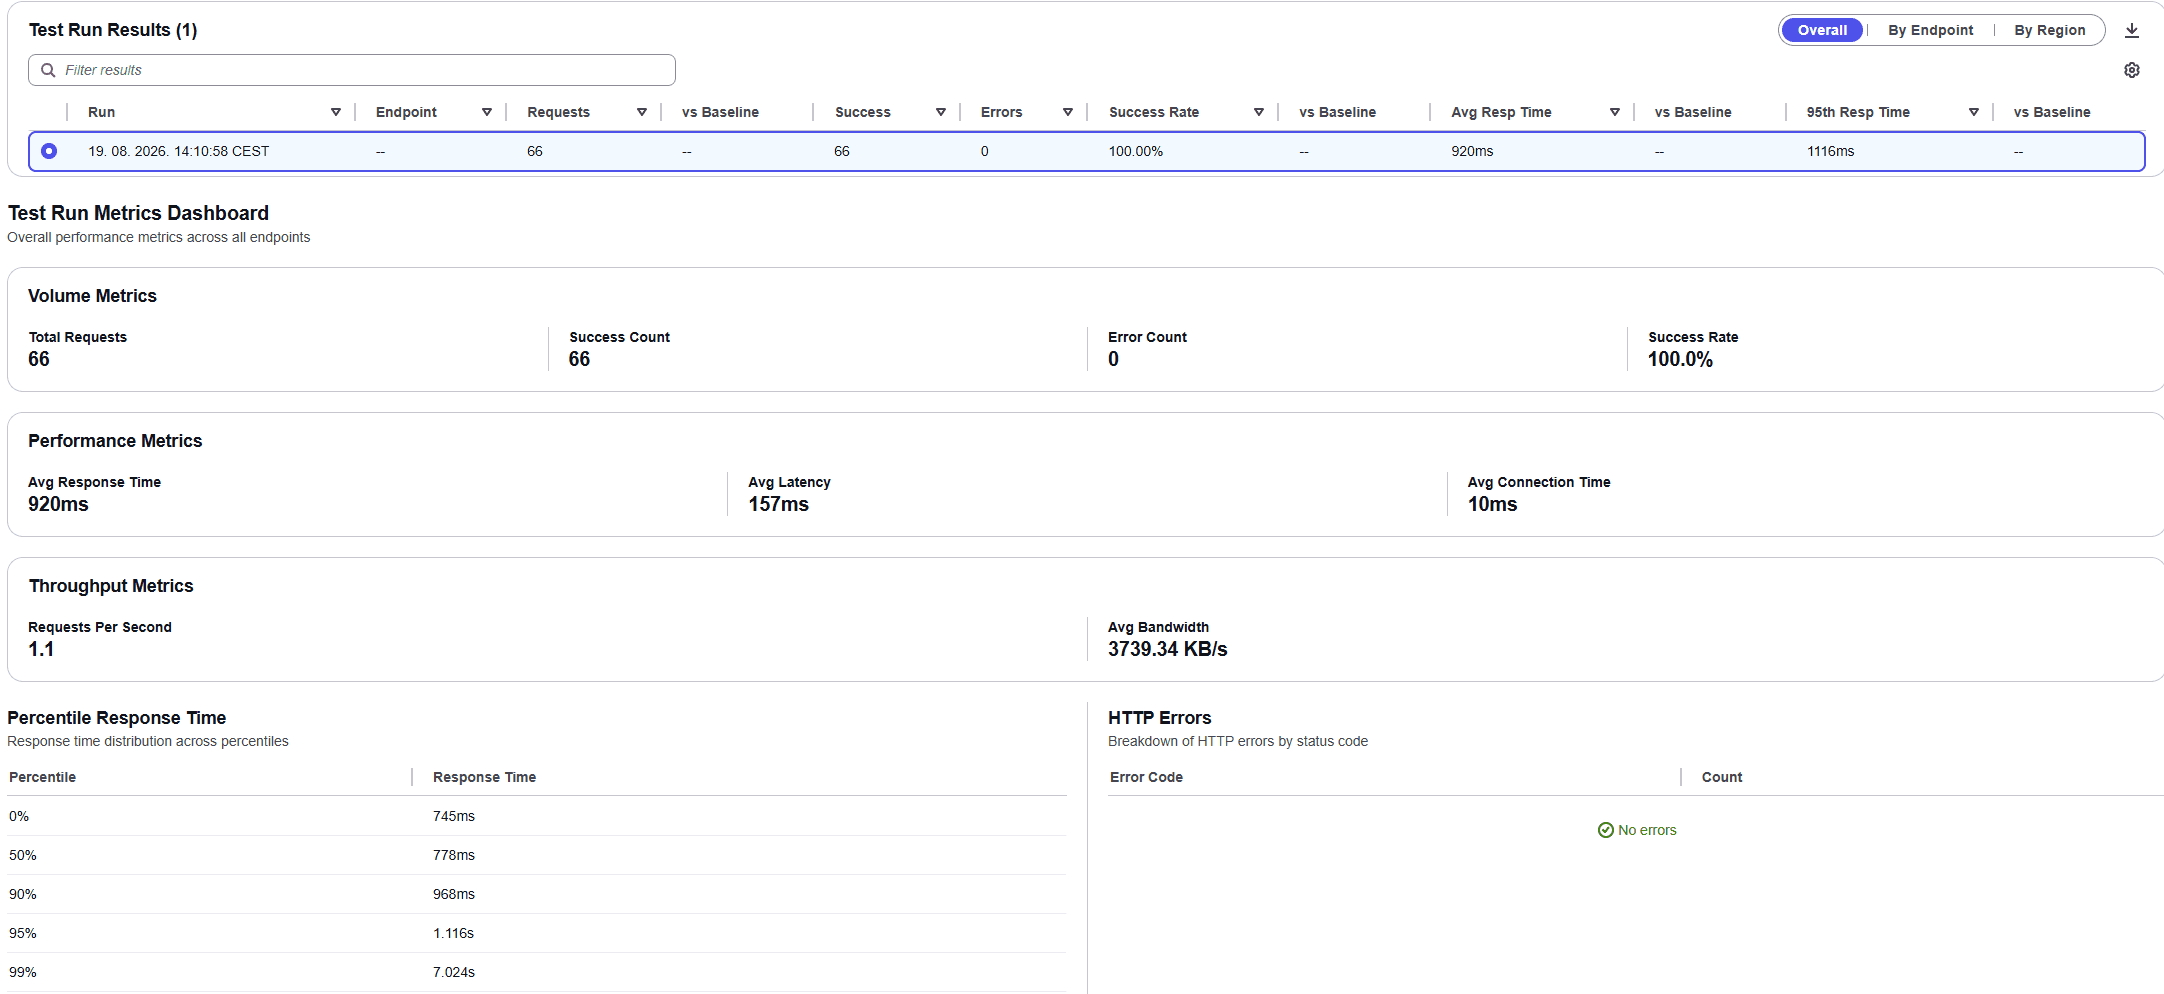
The metrics dashboard. The percentile table on the left is the part worth studying.
Volume metrics are the sanity check: total requests, success count, error count, success rate. Ours reports 66, 66, 0, 100%.
Resist reading anything into a 100% success rate at one concurrent user. Of course it succeeded. Success rate only becomes a meaningful number once you are applying enough load that something might fail. At this size it confirms the plumbing works.
Performance metrics give three numbers that people routinely conflate, and separating them is the single most useful diagnostic on this page:
- Average connection time, 10ms. Establishing the connection, including TLS.
- Average latency, 157ms. Time to the first byte of the response.
- Average response time, 920ms. Time to the last byte.
Subtract and you learn something the average alone hides. The server produced its first byte in 157ms and the remaining 763ms was spent transferring the body. That is not a slow application. That is a large response.
If those three numbers had come back as 10ms connection, 850ms latency and 920ms response, the diagnosis would be the opposite: the server is thinking for 850ms and the payload is small. Same average response time, completely different problem, completely different fix. Always read the split, never the total.
Throughput, and what bandwidth tells you
Requests per second, 1.1. Consistent with 66 requests over a one-minute hold, which is a useful cross-check that the test ran as configured.
Average bandwidth, 3739.34 KB/s. On its own this is hard to interpret. Divided by throughput it becomes the average response size:
3739.34 KB/s / 1.1 requests per second = about 3.3 MB per response
Do that division on every run. It is the fastest way to spot a payload problem, and 3.3 MB for a single document response is large enough that our next step is checking what the endpoint is actually returning. Response size drives your transfer costs, your CDN bill and your mobile users' experience, and it is invisible in a latency graph.
The percentile table, and the trap in it
This is where the run gets genuinely instructive. The percentile breakdown reads:
| Percentile | Response time |
|---|
| 0% | 745ms |
| 50% | 778ms |
| 90% | 968ms |
| 95% | 1.116s |
| 99% | 7.024s |
| 99.9% | 7.024s |
| 100% | 7.024s |
The shape up to p95 is healthy. A tight cluster from 745ms to 1.1s means consistent behaviour with no long tail worth worrying about.
Then p99 jumps to 7 seconds. The instinct is to treat that as a finding. It is not, and the reason is arithmetic.
Your percentile resolution is capped by your sample count. We made 66 requests. One percent of 66 is 0.66, so there is not a single full request in the top 1%. That is why p99, p99.9 and p100 are all identical at 7.024s: they are all describing the same one slow request, which is simply the slowest of the 66.
So the honest read is that one request out of 66 took 7 seconds, and 66 samples cannot tell you whether that is systematic or a one-off. It might be a cold cache, a CloudFront miss going to origin, a DNS or TLS hiccup on the first request of the run. It is a hypothesis, not a result.
The rule of thumb worth carrying: you need at least 100 requests before p99 contains a single sample, and a p99 you would put in front of a client needs thousands. For p99.9, multiply by ten again. If a percentile in your report is backed by one request, say so, or do not report it.
This is also why the same run at a realistic size is a completely different conversation. At 5,000 requests, a p99 of 7 seconds means fifty slow requests and a real pattern to chase.
Baselines, and the empty comparison columns
Every results table has "vs baseline" columns, and on a first run they are all empty, with a notice explaining that no baseline has been set for the scenario.
Setting one turns this from a snapshot into a regression check. You pick a run from the history and mark it as the baseline, and every subsequent run of that scenario reports its deltas against it: requests, success rate, average response time, 95th percentile.
Two habits. Do not baseline your first run. Baseline a run you trust, at a realistic size, from a build you are happy with. And re-baseline deliberately after an intentional change, otherwise you will spend a month comparing against an architecture you no longer run.
The other tabs
Errors breaks failures down by HTTP status code. Ours shows no errors, which at one user is expected. Under real load this is the first tab to open, because the distinction between 429, 502 and 504 tells you which layer gave up: throttling, a backend refusing connections, or something timing out upstream.
Artifacts holds the raw output from the underlying framework. When the dashboard summary is not enough, this is where the detail lives, and it is what you want if you are feeding results into your own analysis.
Investigations, along with the investigate button at the top of the run, is the MCP server path if you enabled it at install. It lets an AI tool read the run data and reason about it in natural language. Useful for a first pass over a large result set. Treat what comes back as a hypothesis to verify against the numbers, the same way you would treat the 7-second outlier above.
What to do with a first result like this
Nothing yet. This run tells us the harness works and the page responds in under a second at rest. The next steps in order:
- Calibrate one task upward until the container is the constraint, as described in the previous section.
- Run a stepped test to find where latency bends.
- Set a baseline from the run at the load you actually care about.
- Schedule it weekly so the next regression shows up as a delta rather than a surprise.
What a run costs
The generator is rounding error
AWS estimates about $30.90 a month to run the solution with default settings in us-east-1. Of that, $29.62 is Fargate and the rest rounds to nothing, so the cost model is simply task-hours.
At on-demand Linux x86 pricing in us-east-1, a default 2 vCPU and 4 GB task works out at about $0.099 an hour. Prices differ by region and change over time, so redo this with current numbers for the region you test from. That prices any test on the back of an envelope:
| Test shape | Rough Fargate cost |
|---|
| 50 tasks, 1 hour | $5 |
| 200 tasks, 1 hour | $20 |
| 500 tasks, 45 minutes | $37 |
| 1,000 tasks, 30 minutes | $49 |
At 200 users per task, the third row is 100,000 concurrent virtual users for the price of a team lunch.
Add startup overhead to those figures. Our one-minute smoke test occupied nearly four minutes of wall clock once container launch and results parsing were counted. On a long test that overhead disappears into the noise. On a batch of short ones it is most of the bill.
The costs worth predicting sit on the target side:
- NAT Gateway processing, charged per GB on top of the hourly rate. On a high-volume test this can be several times the compute cost. Put test tasks in a public subnet unless you have a reason not to.
- Request-priced services. AWS WAF bills per million requests inspected, CloudFront per request and per GB, API Gateway per million calls. A test generating a hundred million requests is a real line item.
- Data transfer out, especially with large responses.
- The scaling you are deliberately triggering. Those extra instances run for the length of the test.
- CloudWatch logs, particularly with live data switched on.
Two habits. The solution tags its resources SolutionId: SO0062, so activate the tag and build a cost category to see test spend on its own. And set a budget alarm before the first big run rather than after the first invoice.
Validating auto scaling
Capacity and rate are different limits, and only one shows up in a gentle ramp
This is the most useful thing the tool does, and the part most teams get half right.
Your auto scaling group can reach 200 instances. Fine. How fast can it get there from 12? That includes the CloudWatch alarm evaluation period, the policy cooldown, instance launch, image pull, application start and health checks passing. Five to seven minutes is normal. A traffic spike does not wait five minutes.
A slow enough ramp hides this. Scaling keeps up, everything looks healthy, and the platform falls over the first time a push notification goes out to the whole user base. So run two tests and read them differently.
A stepped test finds capacity. Increase load in steps, hold each until it stabilises, and record throughput, error rate and p50/p95/p99 at each level. The step where latency bends is your working ceiling. The step where errors begin is the hard ceiling. The gap between them is your safety margin.
A spike test finds rate. Go from baseline to target as fast as real traffic would, and watch what breaks during the ramp rather than at the plateau.
The rates worth knowing:
- ALB. Load balancers scale reactively rather than instantly, and AWS publishes no SLA for how fast. The commonly cited working figure is that an ALB roughly doubles capacity in about five minutes, which lines up with the long-standing advice to raise test load by no more than 50% every five minutes. Treat both as planning assumptions, not guarantees, and measure your own. Since late 2024 you can reserve a minimum instead of asking support to pre-warm. Minimum reservation is 100 LCU and you can only decrease it twice a day.
aws elbv2 modify-capacity-reservation \
  --load-balancer-arn "$ALB_ARN" \
  --minimum-load-balancer-capacity CapacityUnits=100
- Lambda. Two limits that look identical on a dashboard and need opposite fixes. The account ceiling starts at 1,000 concurrent executions per region, though plenty of mature accounts have had it raised, which is exactly why you check rather than assume. Separately, each function adds at most 1,000 execution environments every 10 seconds. Rate throttling gives you 429s while the concurrency graph sits well below the limit, and the answer there is a queue in front or provisioned concurrency, not a quota increase. The arithmetic is worth internalising: from cold, reaching 10,000 concurrent executions takes about 100 seconds at that rate no matter how much account quota you hold.
- DynamoDB. A new on-demand table starts with warm throughput around 12,000 read units and 4,000 write units per second and grows as it observes peaks. Separately, one partition caps at 1,000 write units and 3,000 read units per second, so a hot key throttles you well below the table's headline numbers. Use realistic key distribution or you get a comfortable, wrong answer.
- Connection pools. RDS
max_connections, RDS Proxy, Redis, and the HTTP client pools inside your own services. These saturate quietly and show up as latency rather than errors.
The quotas that get in the way
Service quotas are per account and per region, which is the part that catches people
The most common way to waste a load test is to run it in a staging account with different quotas than production. That is not just imprecise, it is misleading. Passing in staging because staging has a higher Lambda concurrency limit than production is worse than not testing at all.
Check both sides first. The one that stops the test itself is Fargate vCPU, and the scenario form shows it to you directly in the regional task availability panel. If you want it before you open the console, or you want it in a pipeline check:
aws service-quotas get-service-quota \
  --service-code fargate --quota-code L-3032A538 \
  --region eu-central-1 --query 'Quota.Value'
The default task is 2 vCPU, so 200 tasks needs 400 vCPU in that region. New accounts often sit well below that and the console will simply cap your task count. Request the increase days ahead, not on the morning of the window.
On the target side the usual suspects are API Gateway account and usage plan throttling, Lambda concurrency, Cognito authentication rates, and the throughput limits on SQS, SNS and Kinesis. If you run a device fleet, AWS IoT Core has its own: a default of 500 connect requests per second per account per region, roughly 100 messages per second and 512 KB per second per connection, and separate account limits on inbound publishes and subscriptions that differ between regions. A fleet reconnecting after a network blip hits all of those at once, which is a very different test from steady-state traffic. The arithmetic is unforgiving. A fleet of 100,000 devices divided by 500 connects per second is 200 seconds of reconnection in the best case, and the best case assumes perfect pacing, which firmware without backoff and jitter does not do.
Two more things a load test reliably exposes:
Retry amplification. A service slows, clients retry, retries multiply the load, the service slows further. If clients retry without exponential backoff and jitter, a test at 70% of capacity can produce a full outage where the same platform at 100% would have degraded gracefully. Test with the retry behaviour your apps actually ship.
Third-party APIs in the request path. Your test will hammer whichever payment provider or notification gateway sits behind your endpoint, and that traffic is real to them. Stub it or get permission, or you turn your load test into someone else's incident.
WAF, Shield and the rules of the road
Your load test looks like an attack, because structurally it is one
A few dozen Fargate tasks present as a few dozen source IP addresses, each generating an implausible volume of traffic. A rate-based rule in AWS WAF aggregating on source IP matches that almost immediately, and your error graph goes vertical while you conclude, wrongly, that you found an application limit.
There are two separate tests here and conflating them produces numbers that mean nothing.
Testing the edge. Leave the web ACL exactly as production has it. What you are measuring is whether the rules fire where you intended, and BlockedRequests is the output that matters.
Testing origin capacity. Let the test traffic through on purpose, usually with a rule at priority 0 allowing requests that carry a shared secret header, with the value kept in Secrets Manager and rotated when the window closes. Then measure the application.
Related things worth knowing:
- Put new rules in Count mode for the first pass. Count tells you what a rule would have blocked without blocking it, and that often produces a more valuable finding than the load test.
- CAPTCHA and Challenge actions cannot be satisfied by a load generator, and Bot Control will correctly classify your test as a bot. Anything behind those needs an exemption or the results are meaningless.
- Do not tune rate limits mid-test. Changing the limit, window or aggregation on a live rule resets its counts and can pause rate limiting for about a minute.
- Rate-based rules use a window of 1, 2, 5 or 10 minutes, default 5, and AWS enforces the limit approximately rather than exactly.
On Shield: Standard is on for every AWS customer at no charge and needs no configuration. Shield Advanced is a paid subscription, around $3,000 a month per organisation on a one-year commitment plus data transfer fees, and it covers standard AWS WAF costs on protected resources, which changes the arithmetic on a heavy test. If you run it with health-based detection wired to Route 53 health checks, a load test can push your application into an unhealthy state and change how Shield reasons about your traffic.
Where AWS draws the line
A load test is not a DDoS test, and AWS treats them completely differently.
- Load testing needs no approval below 1 Gbps. The Amazon EC2 Testing Policy covers network stress tests sustaining, in aggregate for over a minute, more than 1 Gbps or 1 Gpps. Above that, submit a Simulated Event form at least two weeks ahead.
- CloudFront has its own guidance. Spread traffic across tasks and regions, allow at least 30 minutes of ramp-up, and get pre-approval above 500,000 requests per second or 300 Gbps. Unapproved traffic that affects CloudFront availability may be throttled.
- DDoS simulation is a separate policy and must be performed by a pre-approved AWS DDoS Test Partner. If the goal is validating Shield against a real attack profile rather than validating capacity, that is a different engagement with a different vendor.
The duller operational point matters just as much. Tell your on-call before the test, not during, and tell the security team. A well-run load test can generate more incident response effort than the finding was worth, purely because nobody sent the message.
A checklist before each run
Before opening a test window, make sure the run is representative, the environment is ready, and there is a clear way to stop if something goes wrong.
Test setup
- Success criteria are defined — target throughput, p99 ceiling, error budget, and time to steady state.
- Traffic mix reflects production — based on ALB and CloudFront access logs, not intuition.
- The load generator is calibrated — test latency and target latency agree at the chosen concurrency.
- Enough requests are planned — the percentiles we report have enough samples behind them.
- A baseline is saved — so the next run is a comparison, not a fresh guess.
Infrastructure
- Quotas are checked on both the test and target accounts.
- Fargate vCPU quota covers task count × 2.
- Web ACL strategy is decided — edge test, or origin test with the header allowlist.
- New WAF rules are in Count mode for the first pass.
- LCU reservation matches production.
- Third-party APIs are stubbed or cleared.
- Real client retry behaviour is included.
Before starting
- A one-user smoke test passes before any meaningful traffic is sent.
- On-call and security are notified of the test window and expected traffic shape.
- Stop conditions are agreed.
- Someone can cancel the run within seconds.
- Budget alarm is live.
Tearing it down
Deleting the stack does not delete everything
When the testing is finished, remove it. An idle deployment is a console with credentials, a VPC and a set of IAM roles sitting in your account for no reason.
Delete it the same way you created it. A Launch Wizard deployment gets deleted from the Launch Wizard console, which is also what cleans up any resources left behind if you ever ticked disable rollback on failure. A stack you created directly in CloudFormation gets deleted in CloudFormation. Regional stacks are separate stacks, so each spoke needs deleting on its own.
Two things to do in the right order.
Export anything you want to keep first. The results table has a download control, and once the stack is gone so is the run history. If a run is going into a report or a client deliverable, get it out before you start deleting.
Then check what survived. The S3 buckets and DynamoDB tables holding your test data and artifacts are retained rather than removed with the stack, which is sensible default behaviour for anything holding data and surprising if you were not expecting it. They keep costing storage until you delete them by hand. After the stack is gone, look for leftover buckets and tables carrying the solution's naming and the SolutionId: SO0062 tag, confirm you no longer need what is in them, and remove them.
If you supplied your own container image, that ECR repository is yours and stays. If you pointed the deployment at an existing VPC, the VPC is untouched. If the deployment created its own VPC, that goes with the stack.
Where to start
Deploy the stack into a non-production account, define one realistic scenario against one important path, and run a stepped test to find where latency bends. That single number, requests per second at acceptable latency, is more capacity planning information than most teams have written down anywhere.
Then go looking for the rest: the spike test for scaling rate, the quota inventory, and the WAF behaviour.
We do this as part of cloud engineering work, usually alongside architecture review and cost optimisation, because in practice they are the same question asked three ways. What does this system do under pressure, and what does it cost to make it do that reliably?
If you want a hand with it, get in touch.