Either way, it's production, so whatever we were doing becomes secondary.
We grab the laptop, open the alert and start trying to figure out what actually happened.
The typical workflow begins:
① Check the alert in the channel
Maybe the alert name already tells us what's happening.
② Open CloudWatch
Check the metrics and see if something immediately stands out.
③ No luck.
The metrics aren't telling us enough.
④ Start digging through CloudWatch Logs.
Now we're tired, half-awake, and trying to solve a mystery with three questions in mind:
- What changed?
- What broke?
- How do we fix it?
If we're lucky, a metric immediately tells us what's wrong. Maybe it's a database performance
bottleneck. Add some CPU or RAM, fix the immediate problem, and go back to bed.
But what if the problem is deeper?
To make this more concrete, let's use an example close to our day-to-day work at Ignit:
a large-scale IoT platform running on AWS.
Imagine that IoT devices suddenly stop responding to commands sent from a mobile application.
For the end user, the problem is simple:
"My device doesn't work."
For the DevOps/SRE engineer, that one sentence opens up a lot more questions:
Where did the request fail?
API Gateway? Lambda? IAM?
Did it reach the IoT platform?
AWS IoT Core? MQTT topic? IoT Policy? Certificate?
Did it reach the device?
Device connectivity? IoT Rule?
Or did something change?
A new deployment? Configuration change?
And somewhere in all of that telemetry is the answer.
The good news? We have plenty of data and metrics to investigate.
| Source | What we're checking |
|---|
| CloudWatch | Lambda logs and metrics |
| API Gateway | Requests, latency and errors |
| AWS IoT Core | Connections and messaging |
| IoT Logs | MQTT and authentication events |
| IoT Rules | Message processing |
| CloudTrail | AWS configuration changes |
| GitHub | Source code changes |
| CI/CD | Deployments |
It's now 3 AM, and we'd rather get back to bed than spend another hour manually
digging through operational data. The problem isn't that we don't have enough data.
We probably have too much of it.
Traditional monitoring tells us that something is wrong. The difficult part is understanding why.
And we need to be realistic: whether you like AI or not, one thing AI is particularly good at is consuming and correlating large amounts of information.
Enter AWS DevOps Agent
On December 2, 2025, AWS introduced AWS DevOps Agent in public preview.
Its production operations capabilities later became generally available on March 31, 2026.
One of the ideas behind it is particularly interesting for anyone doing on-call work: instead of waiting for an engineer to manually jump between monitoring tools, logs, deployments and source code, let an agent start connecting those dots.
So, what exactly is AWS DevOps Agent? Rather than repeating the AWS documentation,
let's look at what it actually means from an operational perspective.
At a high level, AWS DevOps Agent is an AI agent built to help with operational and DevOps tasks.
So, is AWS DevOps Agent just another AI agent?
Well... yes and no.
The interesting part is not just the AI.
The interesting part is the context you give it.
Instead of manually taking a bunch of logs and metrics and pasting them into an AI tool, DevOps Agent can work with information from your operational environment and connect it with knowledge about your application.
Think about it like this:
Telemetry
+
AWS resource relationships
+
Code changes
+
Deployment history
+
Infrastructure changes
=
Incident context
That's where things start getting interesting.
Before the agent can play Sherlock Holmes
Before AWS DevOps Agent can investigate our production environment, it first needs to understand what "our application" actually is.
AWS organizes this around something called an Agent Space.
An Agent Space defines the scope in which the agent operates and connects the AWS accounts, application resources, integrations, permissions and other context the agent can use during an investigation.
This matters because seeing that a Lambda function has errors is one thing,
but understanding that this Lambda is part of the request path between a mobile
application and an IoT device is something completely different.
For our simplified IoT platform, the relationship could look something like this:
| Mobile Application | → | API Gateway | → | Lambda | → | AWS IoT Core | ↔ | IoT Device |
At the same time, device messages can flow through the IoT processing path:
| IoT Device | → | AWS IoT Core | → | IoT Rules | → | Lambda | → | Backend |
That application context becomes important when something breaks.
Multi-agent reasoning
AWS DevOps Agent uses a multi-agent approach when investigating operational issues.
Instead of immediately jumping to one conclusion, an investigation can explore multiple hypotheses and try to validate or reject them using the available evidence.
A simplified conceptual view looks something like this:
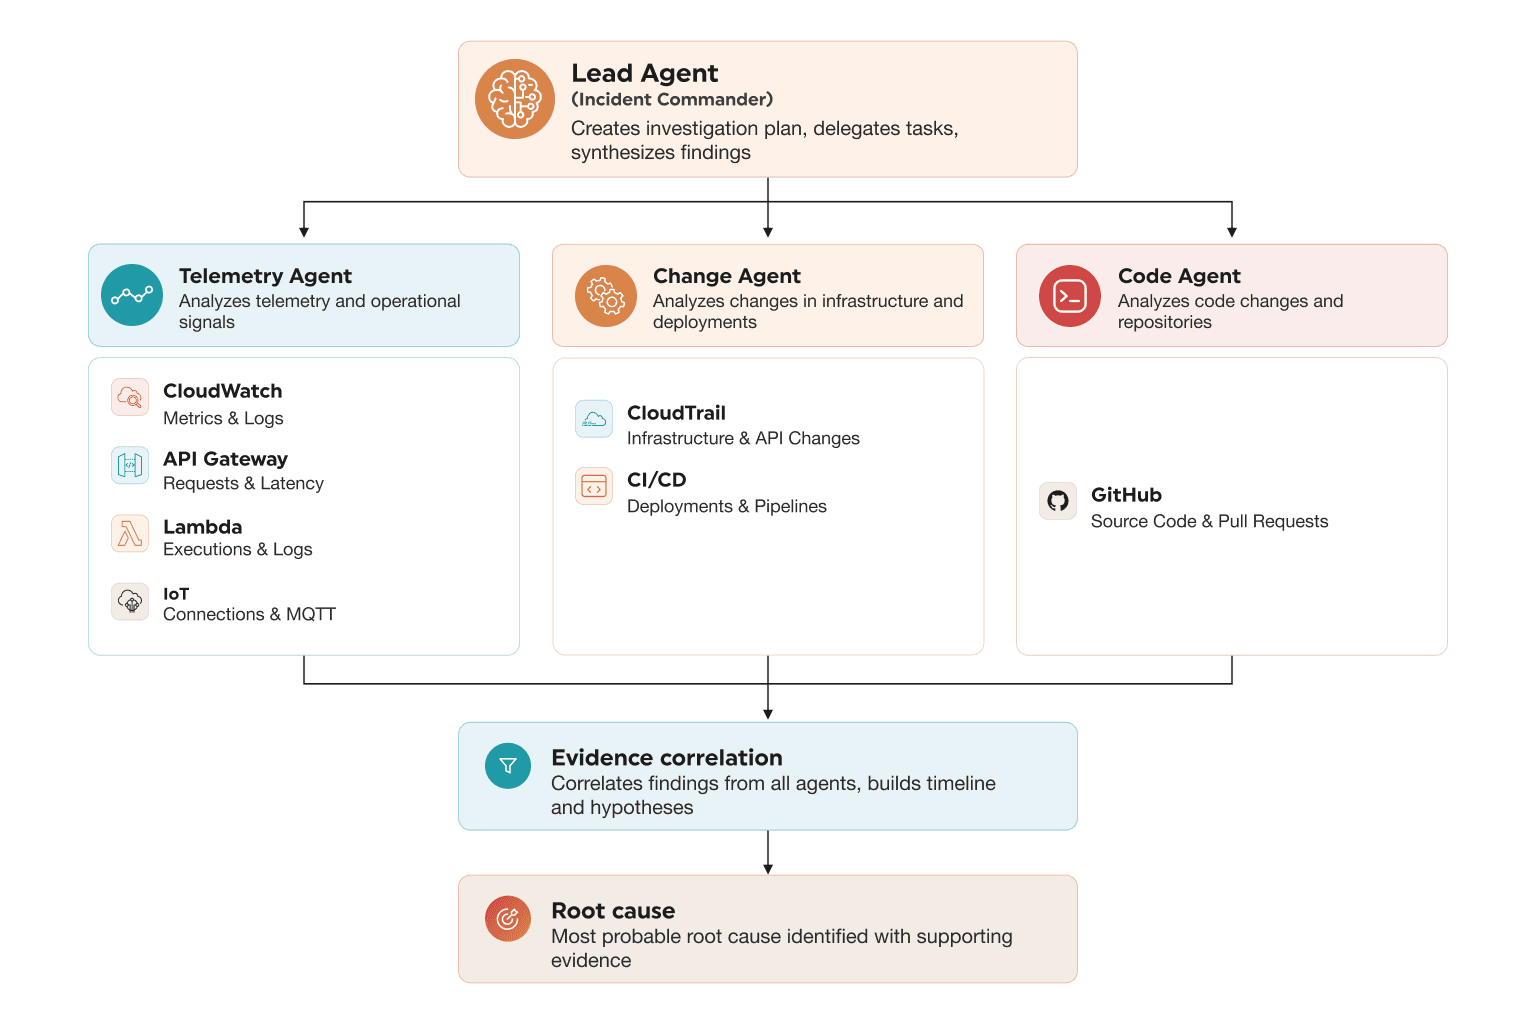
The important word here is conceptual. Telemetry Agent, Change Agent and Code Agent in this diagram are not meant to represent the literal internal names of AWS components. The diagram is simply an easier way to visualize the idea: investigate different sources of evidence and correlate the results before deciding what the most likely root cause is.
And that brings us back to our incident.
Back to 3:30 AM
It's 3:30 AM. We've acknowledged the PagerDuty incident, our SLO clock is ticking,
and we still don't know what's causing the problem.
Here's what we know:
| Component | Signal | Status |
|---|
| API Gateway | Requests | ✓ NORMAL |
| API Gateway | 5xx errors | ✓ NORMAL |
| Lambda | Invocations | ✓ NORMAL |
| Lambda | Errors | ✓ NORMAL |
| IoT devices | Commands | ✗ FAILING |
Our backend looks healthy.
Production doesn't.
Let's assume users can send commands from the mobile application, the API returns success, but the physical devices don't react.
The traditional investigation
Without additional help, our investigation might look something like this:
- CloudWatch alarm fires
- Check API Gateway —
200 OK
- Check Lambda — no errors
- Check IoT publish
- Check IoT Core logs
- Check device connectivity
- Check MQTT topics
- Check deployment history
- Check GitHub diff
- Find the MQTT topic change ✓
And eventually, we find something suspicious.
Before the latest deployment, our backend published commands to:
devices/{deviceId}/commands
After the deployment:
device/{deviceId}/commands
Our devices, however, are still subscribed to:
devices/{deviceId}/commands
One missing "s". That's it.
Lambda doesn't throw an error, API Gateway happily returns 200,
and the message may even be successfully published to AWS IoT Core.
The device simply isn't listening on that topic.
Before:
Lambda
→ devices/123/commands
→ Device ✓
After:
Lambda
→ device/123/commands
→ ✕ Device
Device is still subscribed to:
devices/123/commands
One letter changed = production incident.
Beautiful.
How could AWS DevOps Agent help?
Now let's replay the same incident, but this time with AWS DevOps Agent involved.
This is a hypothetical scenario based on the type of telemetry, deployment and code correlation DevOps Agent is designed to perform. The exact investigation and output will depend on the integrations and context available in your Agent Space.
Let's say device command success starts dropping shortly after 02:07.
The first interesting question becomes:
What changed around that time?
Our deployment history shows:
02:02  Deployment v2.14.3 completed
02:07  Device command failures start increasing
Interesting.
Next question:
Which components changed?
Lambda: DeviceCommandHandler
And then:
What changed in the code?
The Git diff shows a change to the MQTT topic.
Now we have multiple pieces of evidence:
① Incident detected
Device commands are failing.
② Infrastructure looks healthy
✓ API Gateway healthy · ✓ Lambda healthy · ✓ Devices connected
③ Recent deployment detected
DeviceCommandHandler changed.
④ MQTT topic changed
devices/123/commands → device/123/commands
⑤ The pieces connect
Published topic no longer matches the device subscription.
→ Likely root cause found.
With enough context available, an investigation could lead us toward a conclusion such as:
Likely root cause
Device command failures began shortly after deployment v2.14.3.
API Gateway requests and Lambda executions remain healthy, while affected devices remain connected to AWS IoT Core.
The deployment modified the MQTT command topic from devices/{deviceId}/commands to device/{deviceId}/commands.
Existing devices remain subscribed to the previous topic.
Recommended mitigation: Roll back the DeviceCommandHandler change or restore the previous MQTT topic.
Imagine getting pointed in that direction shortly after PagerDuty starts ringing.
Rollback the deployment, restore production, go back to bed...
...and blame the backend guys in the morning.
There is, however, an important catch.
The agent doesn't know what it can't see
AWS DevOps Agent isn't magic.
In our example, how would it know that the firmware running on thousands of physical devices is still subscribed to:
devices/{deviceId}/commands
That information has to exist somewhere the agent can reason over. Maybe the device-side
behavior is represented in another repository, visible through IoT telemetry and logs,
or provided through additional operational knowledge and instructions.
But if the device-side MQTT subscription is completely invisible to our observability
and code integrations, the agent cannot magically know what our firmware expects.
This is an important point when talking about AI in operations:
The quality of the investigation depends heavily on the quality of the context.
Bad observability, missing deployment information and incomplete application knowledge will limit any investigation — human or AI.
Poor observability
+
Missing deployment information
+
No repository integration
+
Unknown device-side behavior
=
Incomplete investigation context
Compare that with:
CloudWatch telemetry
+
Application topology
+
CI/CD history
+
GitHub repositories
+
Operational knowledge
=
Much stronger investigation context
The goal isn't simply to "add AI".
The goal is to give the agent enough context to reason about the system.
There's another useful part of this story: AWS DevOps Agent can integrate with PagerDuty.
That means our investigation doesn't necessarily need to wait for us to manually pick up the incident and start investigating.
With the integration configured, an incoming incident can provide the starting point for an investigation.
While we're still opening dashboards and gathering context, the agent can already be working through the available operational data.
Where does AWS DevOps Agent fit?
At the end of the day, AWS DevOps Agent doesn't replace CloudWatch, GitHub, CI/CD or the rest of our DevOps tooling.
It sits across that operational context and tries to connect information that we traditionally correlate manually.
CloudWatch answers:
What happened to this metric?
CloudWatch Logs answer:
What did this Lambda do?
GitHub answers:
What code changed?
CI/CD answers:
What was deployed?
AWS DevOps Agent tries to answer a different question:
How are these events related?
That's where AWS DevOps Agent becomes particularly interesting.
What does it cost?
Of course, all of this comes with a price. AWS DevOps Agent uses a usage-based
pricing model: we pay for the time the agent is actively working on a task,
billed per second. There is no charge while the agent is idle.
At the time of writing, investigations, evaluations and on-demand SRE tasks
are priced at $0.0083 per agent-second, which works out to
roughly $0.50 per minute of active agent work.
To put that into perspective, AWS gives an example of a small team running
10 investigations per month, with each investigation taking around eight minutes.
The resulting AWS DevOps Agent cost is $39.84 per month.
There can also be additional charges from the AWS services the agent uses during
an investigation, such as CloudWatch Logs Insights queries. Release management
is currently available at no additional cost during its preview period.
So the interesting cost comparison isn't simply AI versus no AI. It's the cost
of a few minutes of agent investigation versus the engineering time spent manually
collecting and correlating the same evidence.
Before giving an AI agent the keys to production...
Of course, there is another side to this.
For DevOps Agent to investigate our systems effectively, we're potentially giving it access to a significant amount of operational context:
- CloudWatch
- AWS resources
- Application topology
- CI/CD
- Source repositories
- PagerDuty
- Operational knowledge
That means permissions and scope matter. The same principle we apply everywhere else
in AWS applies here as well: least privilege.
The agent should have enough access to investigate what it needs to investigate,
not unlimited access simply because it's AI.
And this becomes even more important with IoT.
In a normal web application, a bad automated action might break an API or restart the wrong service.
IoT systems can be connected to the physical world.
Depending on the product, devices might control heating, lighting, motors, pumps, appliances or other physical systems.
There is a very important difference between:
AI identifies a likely root cause
→
AI recommends mitigation
→
Engineer reviews it
→
Action
and:
AI identifies a problem
→
AI changes production
→
AI sends commands to physical devices
We're much more comfortable with the first one.
Should DevOps engineers be worried?
So, should DevOps engineers be afraid of being replaced by an AI agent?
Short answer: No.
AWS DevOps Agent doesn't remove the need for engineers who understand the system. Someone still needs to understand why our mobile application talks to API Gateway, how our Lambdas interact with AWS IoT Core, how our MQTT contracts work, how our devices behave and what is safe to change in production.
Architecture decisions still need engineering judgment.
Business context still matters.
Security still matters.
Risk ownership still matters.
And when an AI agent tells us at 3 AM that the most likely solution is to change something affecting thousands of physical devices, we still want to understand why before clicking anything.
What AWS DevOps Agent can reduce is something much less glamorous:
The amount of time engineers spend collecting and correlating evidence.
And if that means fewer nights jumping between CloudWatch, GitHub, CI/CD and IoT logs at 3 AM,
we're perfectly fine with letting the agent take that part of the job.